
LUC contributes to Defra’s 25 Year Environment Plan indicator G1
LUC is proud to announce the publication of its work contributing towards Indicator G1: ‘Changes in landscape and waterscape character’, on behalf of Natural England.
The work is a key component of the 25 Year Environment Plan's Outcome Indicator Framework (OIF) and this indicator measures progress towards the plan's goal of enhancing natural beauty in England.
What is indicator G1?
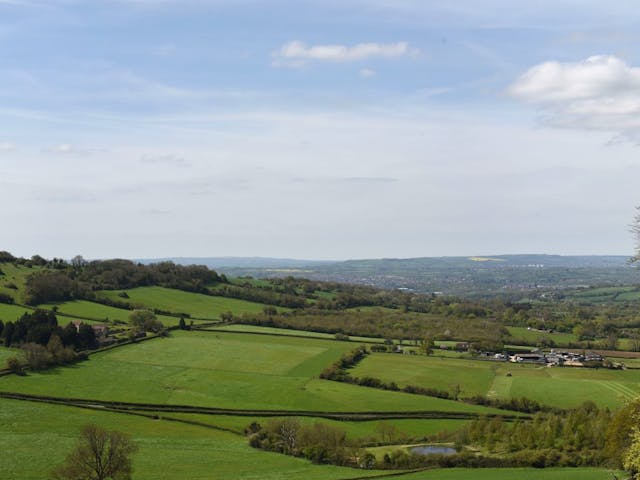
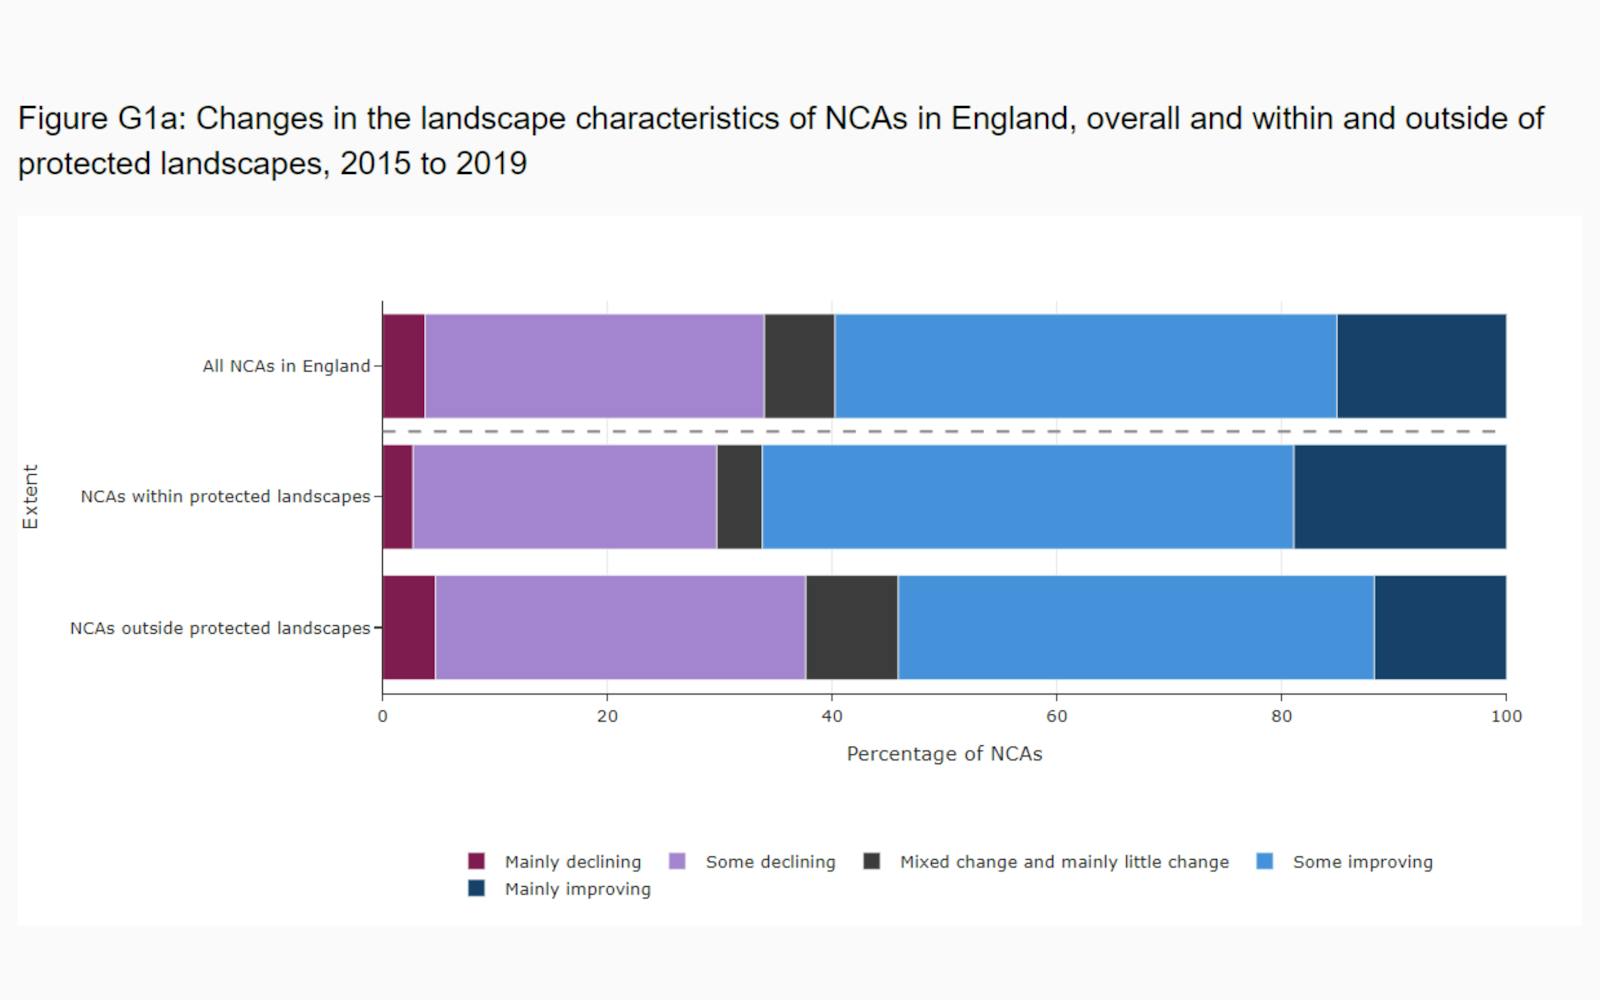
Indicator G1 provides an understanding of the extent to which England's landscapes are changing, considering natural, cultural, and perceptual factors.
The measure currently holds interim status and includes baseline assessment results from circa 2015-2019.
It comprises three elements:
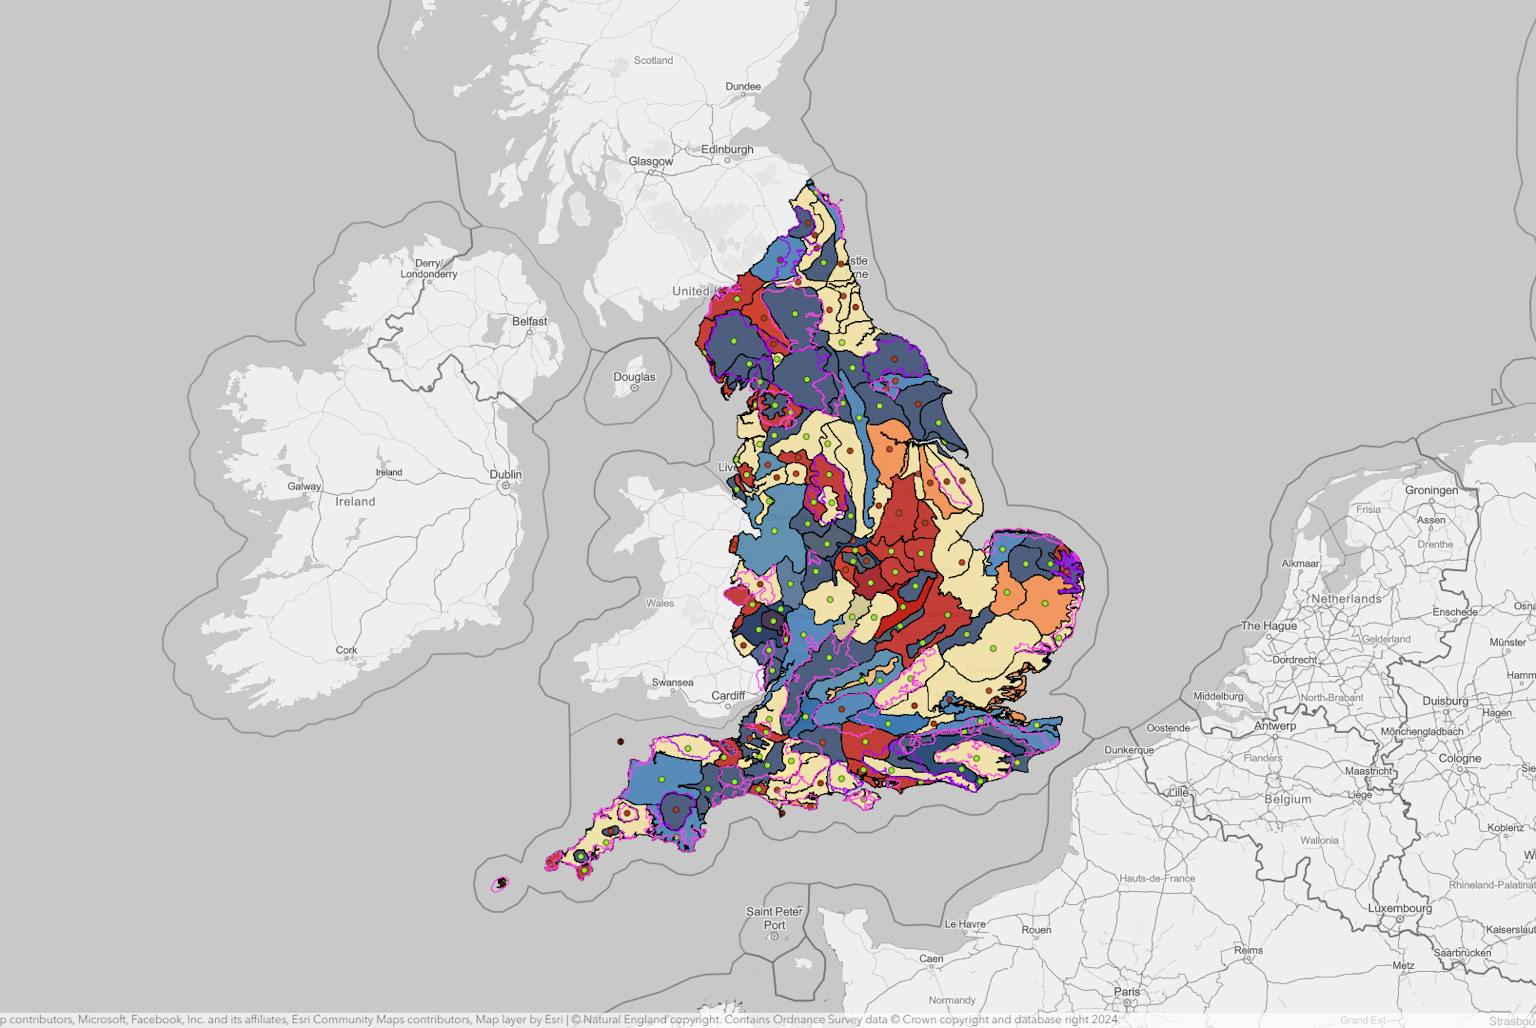
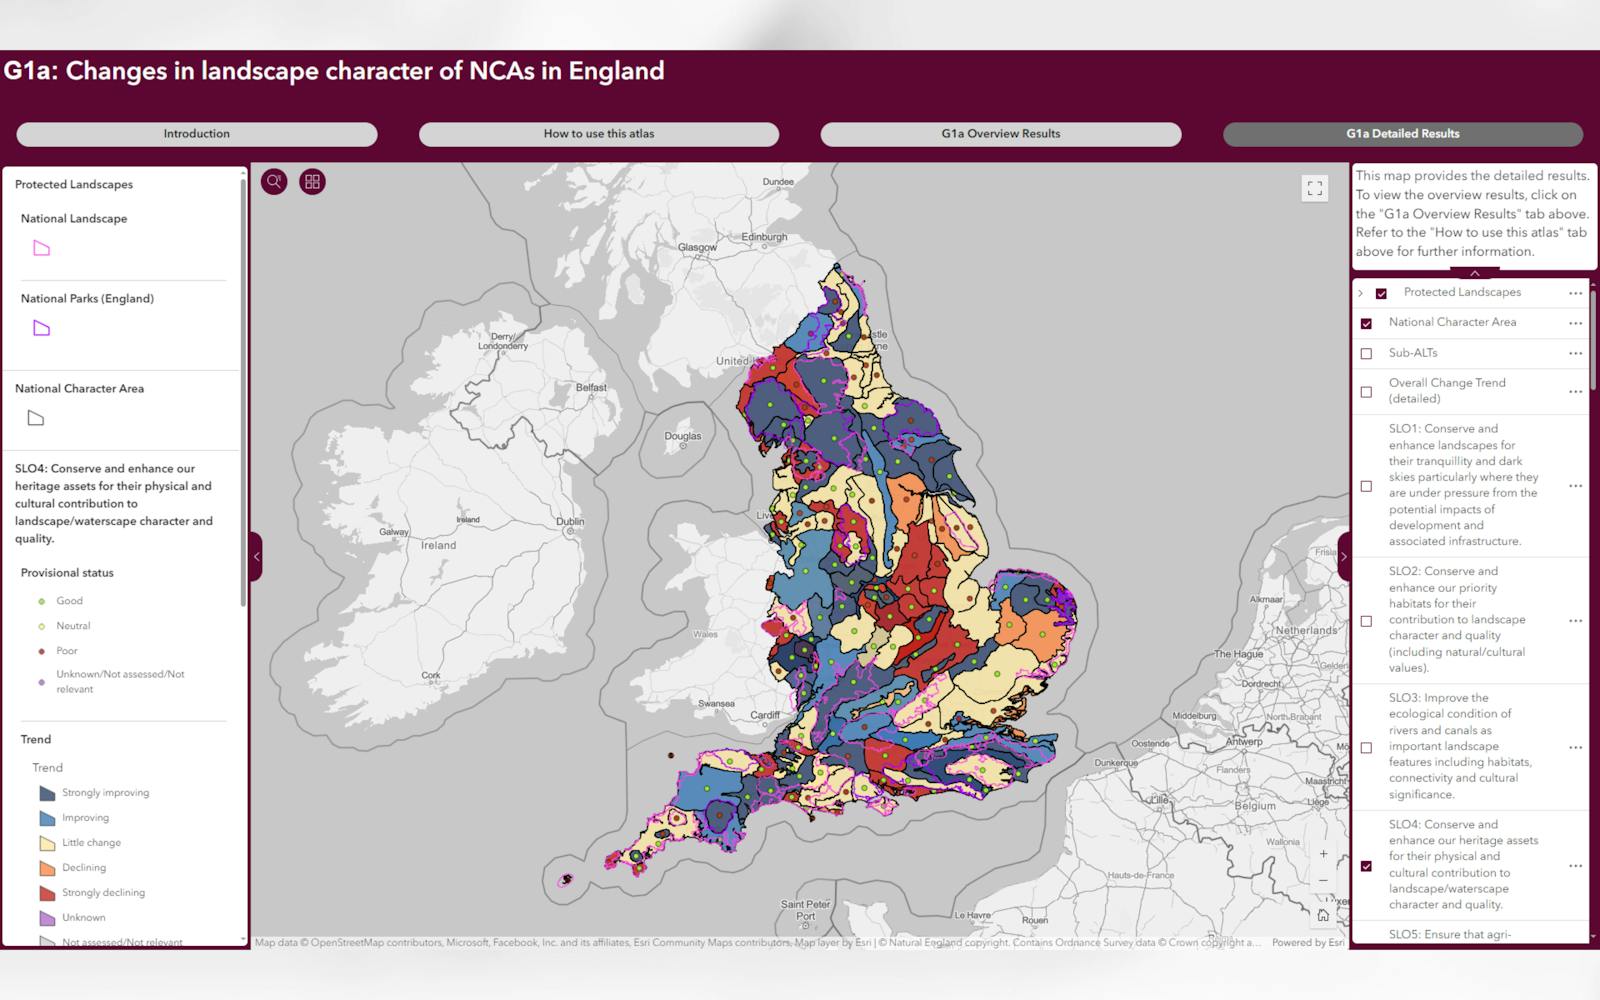
- G1a Atlas: Measures the extent to which landscape changes align with the aspirational outcomes outlined in the National Character Area (NCA) Statements of Environmental Opportunity.
- G1b Agri-environment landscape monitoring: Assesses the influence of agri-environment schemes on conserving and enhancing landscape character in England.
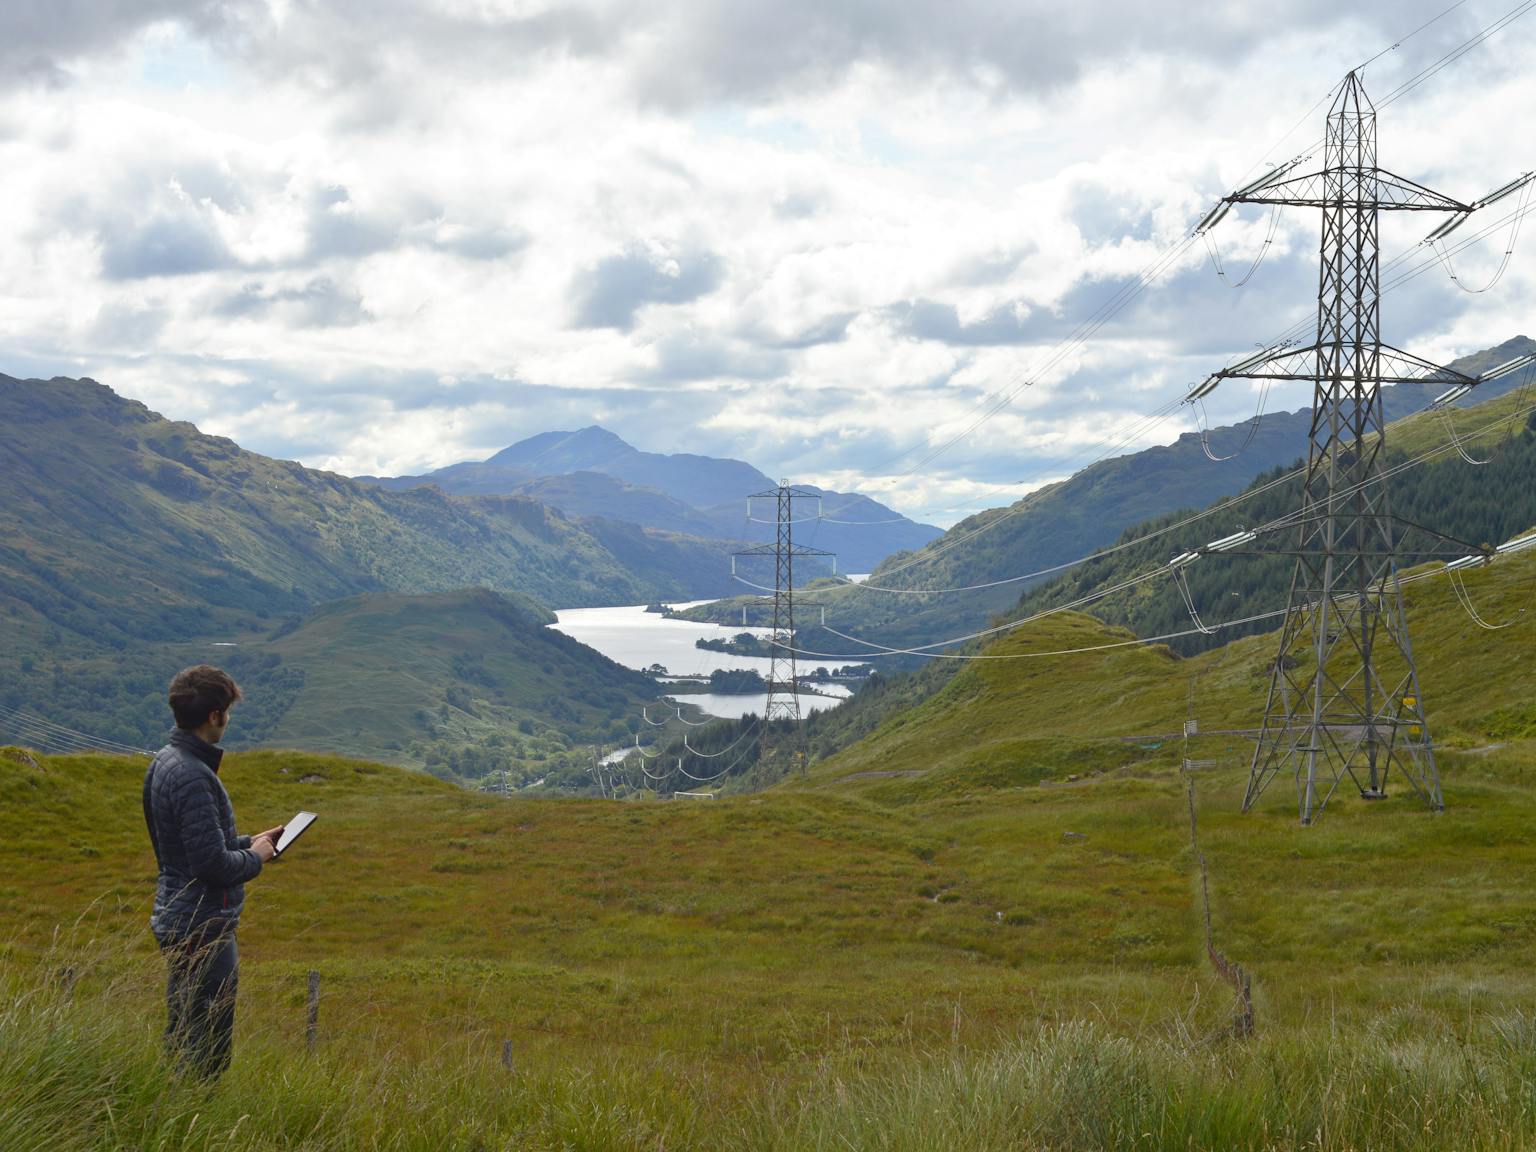
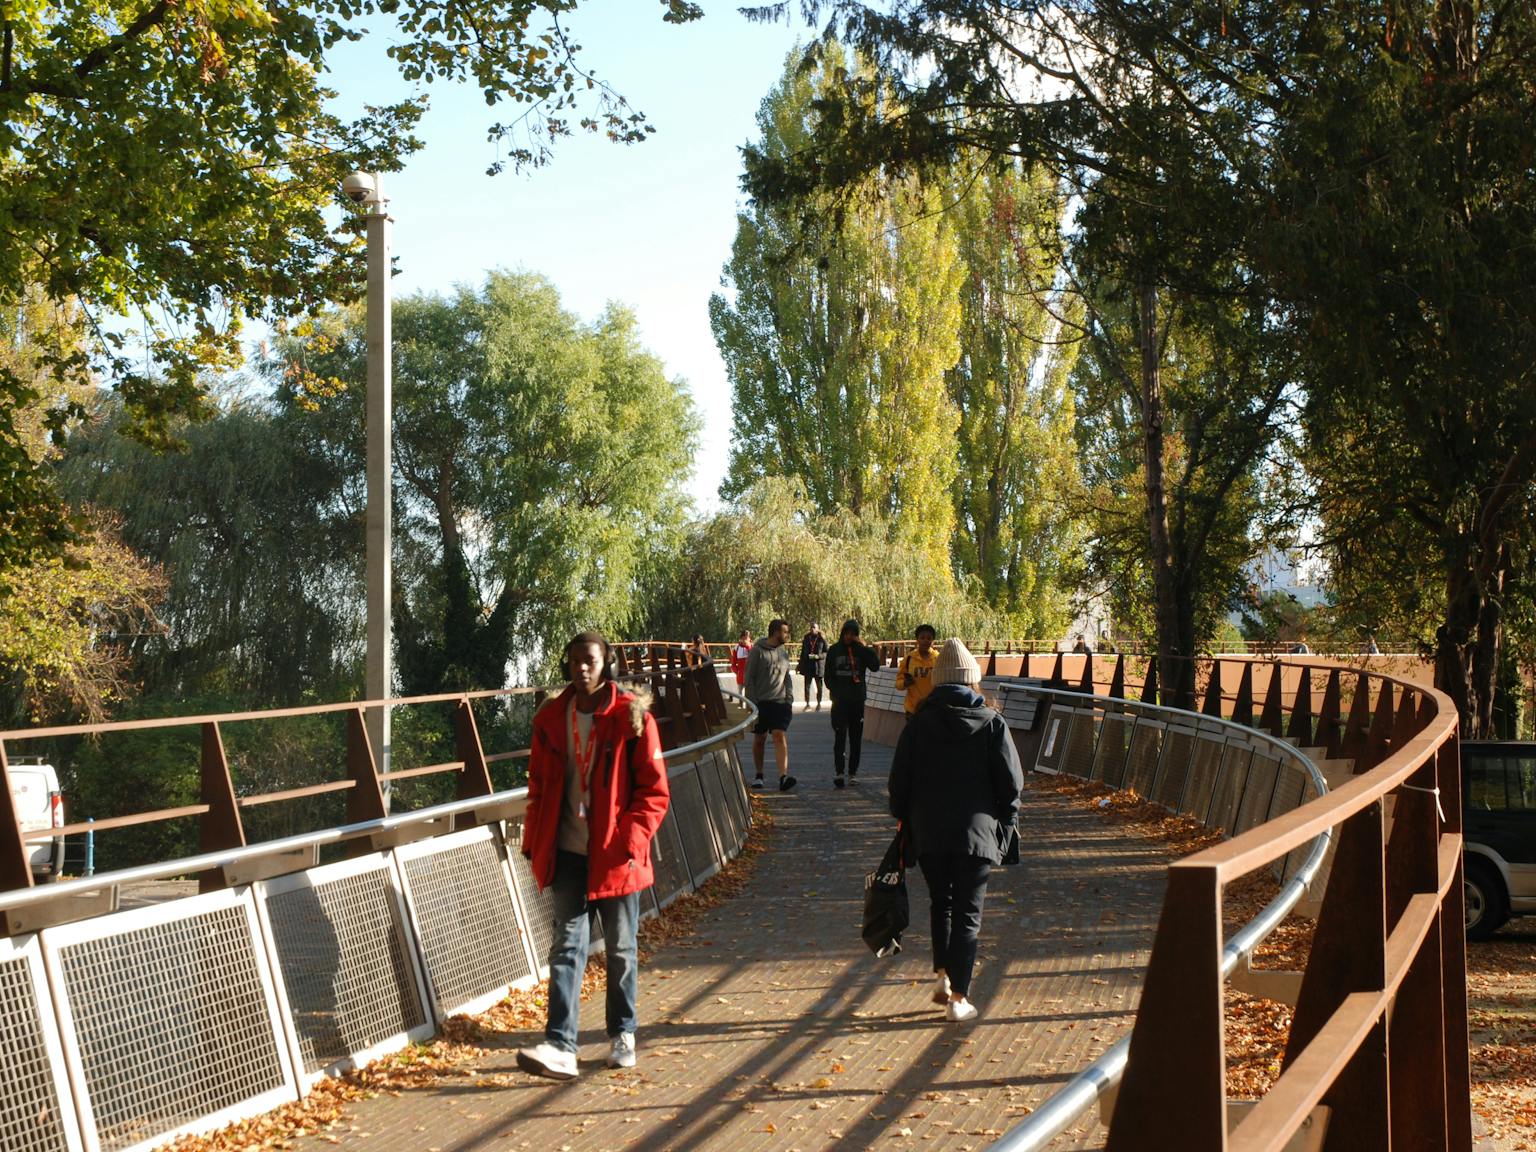
- G1c Spatial changes in visual and experiential landscape character: Maps changes that impact the visual and experiential aspects of landscapes, such as positive and negative visual changes, cultural shifts, and changes in access.
Access the results
You can explore the detailed results and reports of all G1 elements on the Defra OIF website.
LUC’s role
LUC led the work on G1a and G1b in collaboration with Natural England, while the UK Centre for Ecology & Hydrology led on G1c.
Alongside presenting the findings on the Defra 25 Year Environment Plan’s OIF, the detailed results of G1a are also presented on the newly published NCA Profiles website, offering further insights into landscape changes within each area.
An additional output from the study is the creation of a new Landscape Change Evidence Hub. This site provides access to information on a range of national landscape monitoring evidence developed since the 1970s. This hub aims to provide context for further innovative work and to encourage knowledge exchange.
Key contributions
LUC would like to acknowledge the valuable contributions of its project team: Diana Manson, Chris Green, Kim Jones, Natalie Collins, Kate Ahern, and Hannah Germiat.
We also extend our thanks to Natural England’s Chris Bolton and Andy Wharton, as well as the UK Centre for Ecology & Hydrology’s Laurence Jones and David Fletcher.
This collaborative effort represents a significant step forward in understanding and managing landscape change in England.
We encourage you to explore the results and contribute to the ongoing conversation about protecting and enhancing our natural beauty.