Night Blight: Mapping England’s Light Pollution and Dark Skies
Mapping light pollution
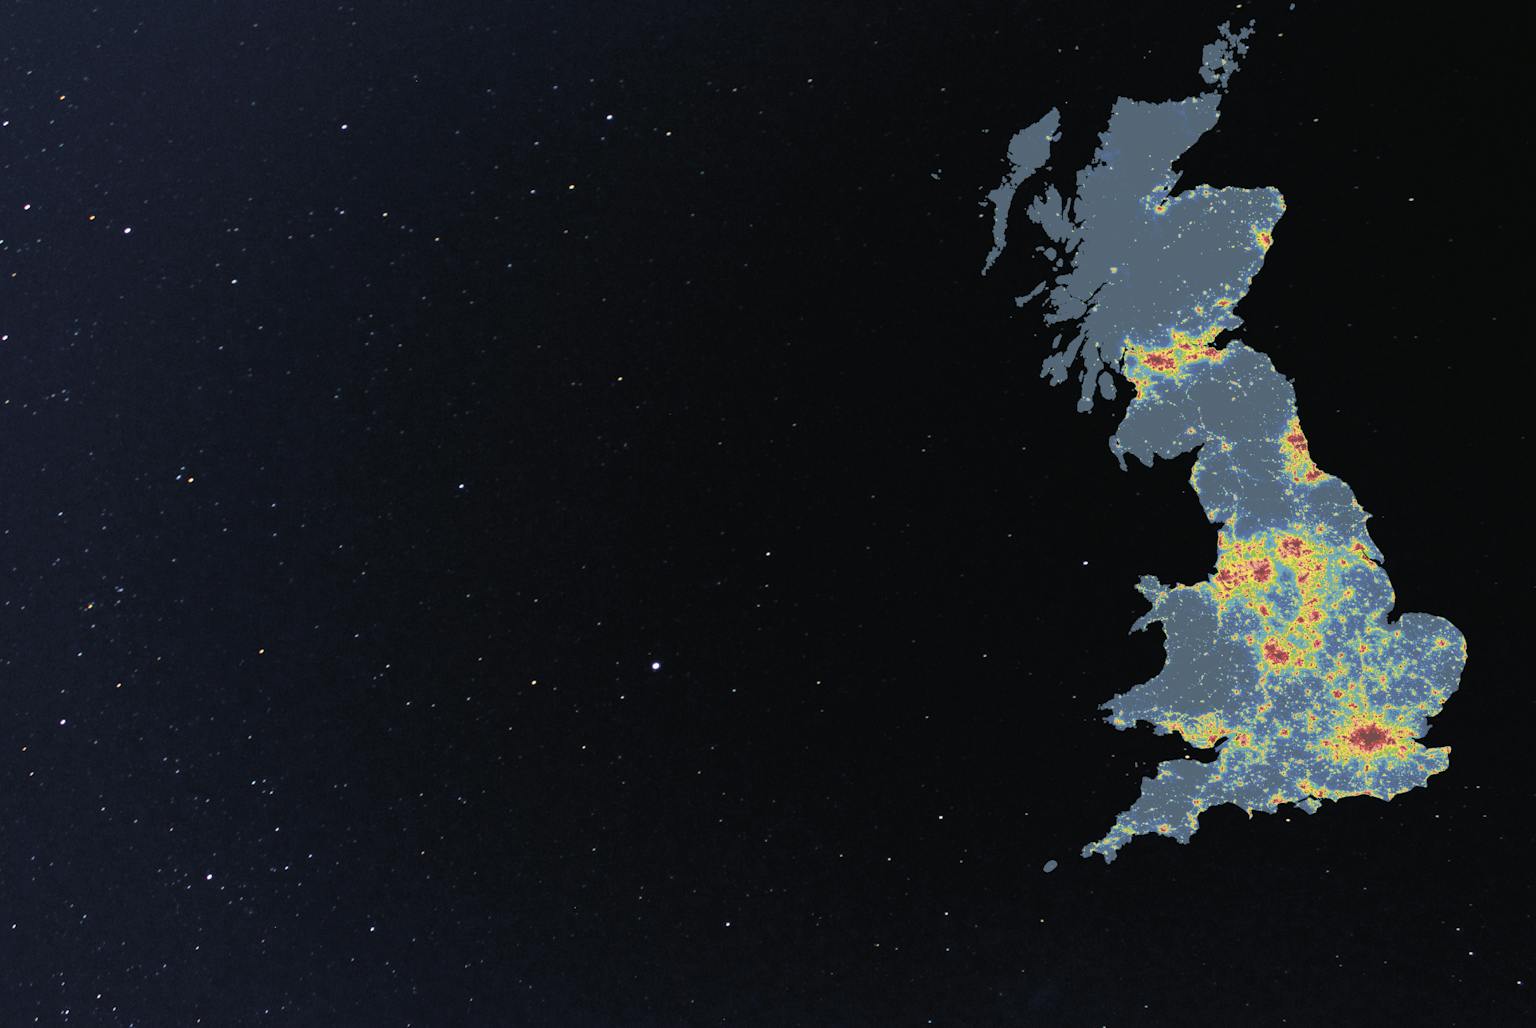
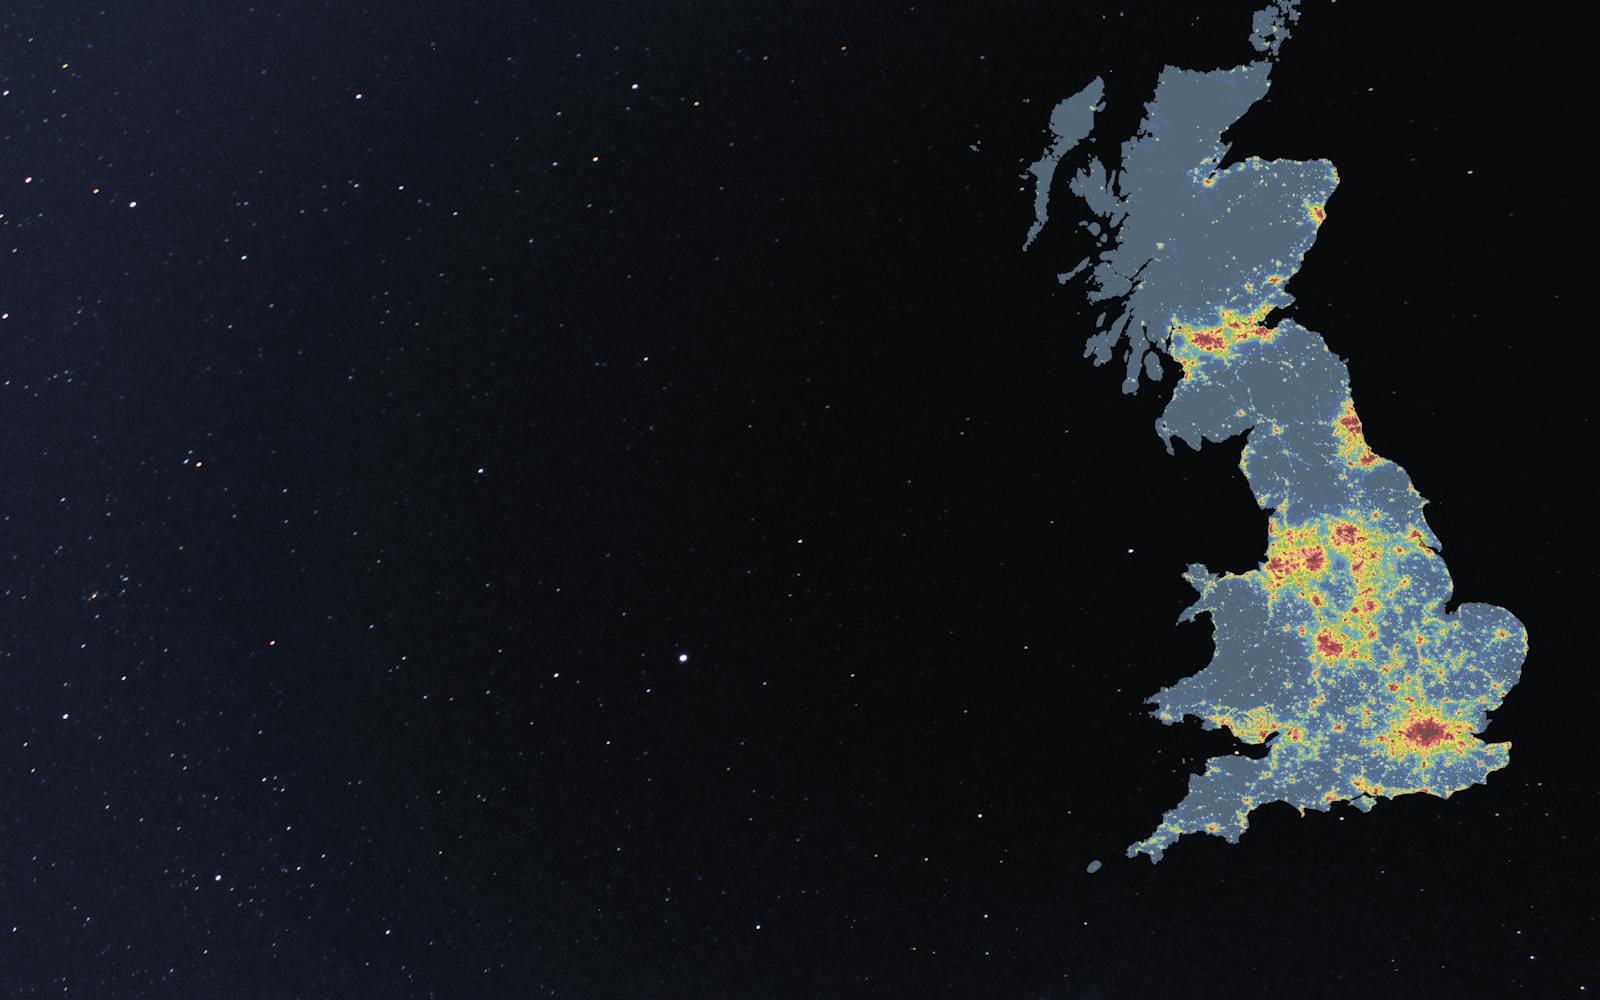
LUC mapped light pollution to help protect England’s dark skies.
Commissioned by CPRE, we analysed satellite data to create an interactive map revealing light distribution and areas with the darkest skies.
Empowering informed decisions
The maps empower communities, businesses and local authorities.
They can use the data to develop sustainable lighting policies, minimise light pollution, and protect England’s natural beauty and nocturnal wildlife.
Expert GIS mapping
Our GIS specialists used NOAA Suomi NPP satellite data to create the interactive map.
Users can zoom in to see light pollution levels by postcode and overlay data layers for informed decision-making.
Detailed local authority reports
LUC also produced PDF maps with statistics for every local authority, county, region and designated landscape.
This granular data provides a clear picture of light pollution at a local level.


